Good ratings can hide the complaint that keeps coming back.
About 1 in 5 reviews that named a complaint still gave four or five stars. That is 71 of 333 complaint reviews, out of 2,365 Google, Yelp, Uber Eats and TripAdvisor reviews at eight restaurants, April to October 2026.

1. One in five complaints came with four or five stars
Of the 333 reviews that named at least one specific complaint, 71 (21 percent, 95 percent interval 17 to 26) were rated four or five stars. Another 66 were three stars. Only 196, about 6 in 10, were one or two stars. It happened at all eight stores, from 10 percent of complaint reviews at one store to 38 percent at another, and about equally at counter-service (22 percent) and full-service (20 percent) restaurants.
Show the numbers as a table
| Star rating | Reviews naming a complaint (of 333) |
|---|---|
| 1 star | 138 |
| 2 stars | 58 |
| 3 stars | 66 |
| 4 stars | 44 |
| 5 stars | 27 |
These are guests who rated the visit well and still wrote down what went wrong. Counted against all good reviews they look rare, 71 of 2,064 or about 1 in 29, which makes them easy to skim past. Counted against complaints, they are a fifth of the total. A review process that starts from the lowest ratings misses 137 of the 333 complaints in this study before anyone reads a word.
2. The same problems come back every month
We split six full months (April to September) into 48 store-months: eight stores times six months. Order accuracy complaints appeared in 42 of them, speed in 38, friendliness in 37 and food quality in 36.
Show the numbers as a table
| Topic | Store-months with a complaint (of 48) |
|---|---|
| Order accuracy | 42 |
| Speed and wait | 38 |
| Friendliness | 37 |
| Food quality | 36 |
A problem that shows up in most months is not one bad night. It is a pattern, and a pattern needs someone to own the next step. Reading the review does not assign that, and replying to the guest does not show the work happened.
3. Order accuracy is only mentioned when it fails
Guests praise friendly people, good food and even fast service far more often than they complain about them. Order accuracy is the exception: 119 reviews complained about it and 16 praised it, and complaints outnumbered praise at all eight stores. With high-confidence labels only, the count is 118 to 16.
Show the numbers as a table
| Topic | Praising | Complaining |
|---|---|---|
| Friendliness | 828 | 126 |
| Food quality | 886 | 121 |
| Speed and wait | 167 | 140 |
| Order accuracy | 16 | 119 |
A clean week of order accuracy will not show up as praise. The complaint is the only signal you get, so each one is worth more than its star rating suggests.
4. Same brand, very different stores
Complaint rates ran from 6 percent to 34 percent across the eight stores, and from 12 percent to 34 percent among five stores of the same franchise brand, with the same menu, systems and training.
Show the numbers as a table
| Store | Reviews with a complaint |
|---|---|
| Store 1 (counter) | 34.3% |
| Store 2 (counter) | 33.3% |
| Store 3 (counter) | 29.1% |
| Store 4 (counter) | 25.2% |
| Store 5 (full) | 19.5% |
| Store 6 (full) | 12.5% |
| Store 7 (counter) | 12.0% |
| Store 8 (counter) | 6.0% |
When stores that share a brand sit three times apart, the brand alone does not explain the difference. It is worth looking at store by store.
5. About one in seven reviews names a complaint
333 of 2,365 reviews (14.1 percent, 95 percent interval 12.7 to 15.5) named at least one specific complaint. Counter-service stores (13.4 percent) and full-service restaurants (15.8 percent) were close; the gap between them is within the range chance alone could produce.
6. Counter-service and full-service guests complain about different things
At the six counter-service stores, complaints centered on order accuracy and speed, each in about 4 of 10 complaint reviews. At the two full-service restaurants, food quality, friendliness and speed led, and value and atmosphere each appeared in about 1 in 5 complaint reviews. Delivery and app problems showed up only at counter service.
Show the numbers as a table
| Topic | Counter service | Full service |
|---|---|---|
| Order accuracy | 41% | 25% |
| Speed and wait | 40% | 47% |
| Friendliness | 33% | 49% |
| Food quality | 31% | 49% |
| Guest recovery | 10% | 12% |
| Atmosphere | 9% | 19% |
| Value | 8% | 19% |
| Digital and delivery | 8% | 0% |
Five questions to ask about your own stores
Ratings tell you how guests felt. These questions test whether your process turns what they wrote into work that gets done and checked. There is no score. Try answering each one for a single location, from records rather than memory.
- Which complaint keeps returning at each location?Not the loudest review. The topic that appears month after month, including in four and five star reviews.
- Who owns the next action?One named person. A reply to the guest is not an owner, and neither is "the team".
- When is it due?A date someone agreed to, not "this week".
- Who confirmed the work was completed?Someone other than the person who did it, so "done" means checked.
- What did later customer feedback show?Whether the same topic kept appearing at that store afterwards. A completed task and a solved problem are different things.
Reading a review does not assign the fix. Replying does not show the work happened. Marking work complete does not show guests noticed. Those are separate records, and the useful question is whether your stores keep them in one place.
Where Replio fits: one record from review to result
Replio connects those steps for each store. Below, each question is matched with what Replio does today and the screen where it happens.
Real Replio interface. Fictional demonstration data. These are separate example states, not one continuous customer record, and not results from this study.
Your questionWhich complaint keeps returning at each location?
What Replio does. Replio collects Google reviews, Yelp reviews where a listing is connected, and DoorDash and Uber Eats feedback from merchant-report imports. It tags every review that has text, at every star rating, by topic and marks each topic positive or negative. Complaints are tracked per store and topic, so a repeat lands on the same issue instead of starting a new thread.
Why it matters. The four and five star complaints from finding 1 are tagged like any other review, so they count toward the pattern.
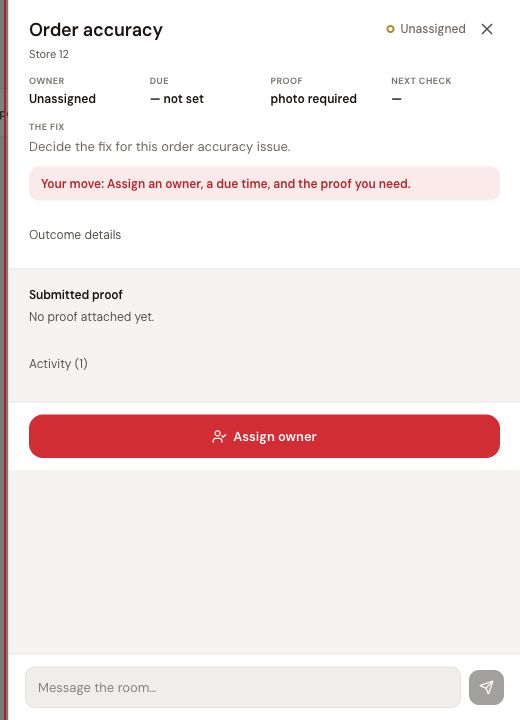
Your questionWho owns the next action, and when is it due?
What Replio does. An owner or leader assigns the issue to one person, with a due date and the fix written in plain words. The screen shows whose move it is next. In this example the due date has passed, so Replio marks it overdue.
Why it matters. Everyone with access sees the same owner and date, instead of the plan living in one manager's head.
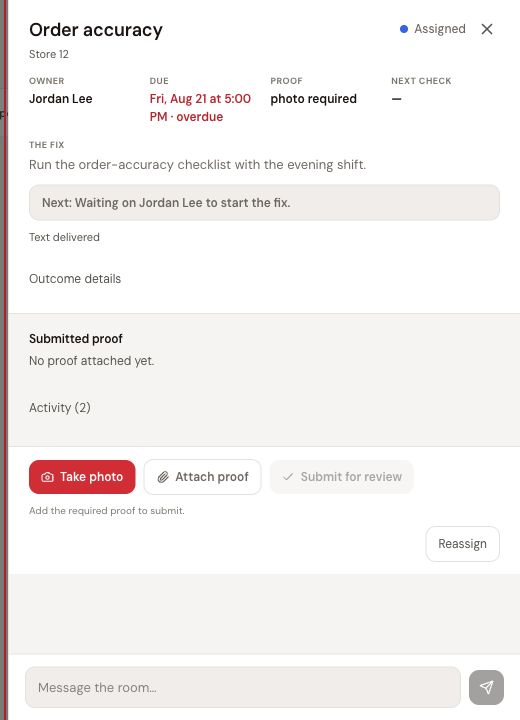
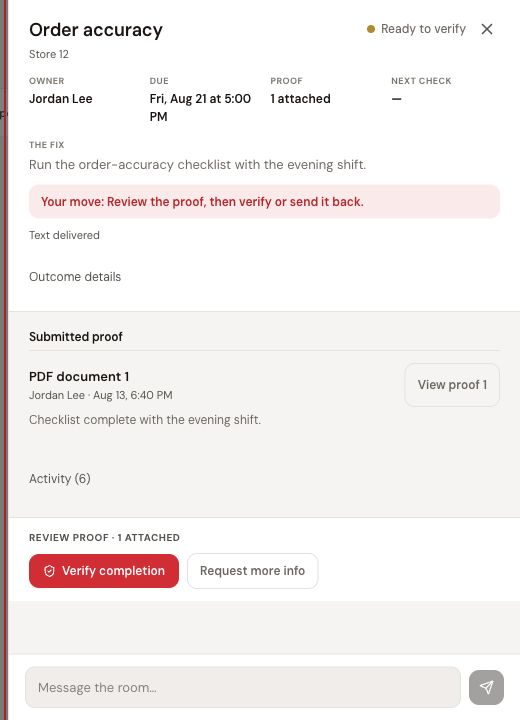
Your questionWho confirmed the work was completed?
What Replio does. The assignee marks the work done. A manager then verifies it or asks for more information. The assignee cannot verify their own work, and Replio records who confirmed it and when. Photos or documents can be attached; they are optional.
Why it matters. "Done" means someone other than the person who did it looked at it.
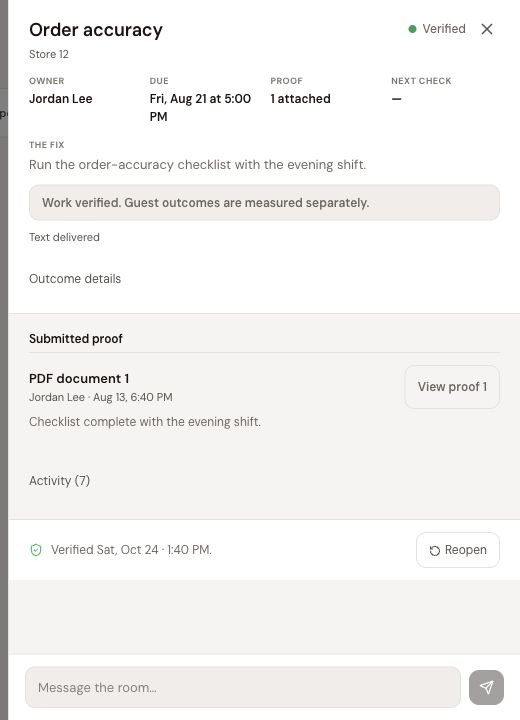
Your questionWhat did later customer feedback show?
What Replio does. After the work, Replio compares reviews on that topic at that store across equal windows before and after (30, 60 or 90 days, with at least five reviews in each). It labels the result Improving, Worsening or No measurable change, or says there are not yet enough reviews to measure it fairly.
Why it matters. A manager's confirmation records that the work was reported complete. It does not certify that guests noticed. Replio keeps those two answers separate, as the screen says: guest outcomes are measured separately.
This section describes the product. The study above does not measure Replio's effect. See the full five-step walkthrough or plans and pricing.
Answer question 1 for one store today.
Paste 20 to 200 reviews from one store into the free Complaint Pattern Finder. You will see how many mention each complaint theme, such as wrong or missing items, slow service or cold food, and what share of the batch each one is. No account. Your reviews stay in your browser.
Find your recurring complaintsRun it on each month of reviews to see which theme keeps coming back. It is a phrase matcher for English food and drink reviews, so check the original reviews before acting on a count.
Prefer to do it by hand?
Once a month, for each store:
- Pull the last three months of reviews, all ratings, not just the bad ones.
- Tag each complaint with one topic: speed and wait, order accuracy, friendliness, food quality, cleanliness, value, atmosphere or guest recovery.
- Fill in a grid like the one below: one row per topic, one column per month, a mark for every month the topic appeared.
- Circle any row with a mark every month. Write one owner's name and a due date next to it, and check the row again next month.
| Topic | Month 1 | Month 2 | Month 3 | Every month? | Owner |
|---|---|---|---|---|---|
| Order accuracy | |||||
| Speed and wait | |||||
| Friendliness | |||||
| Food quality |
The weekly review checklist and the review benchmark worksheet keep the habit going across locations.
Method
Data
Reviews collected by Replio for every active Replio customer account with real data: six owners and eight restaurant locations in five US states. Six are counter-service restaurants (five stores of one quick-service franchise brand and one independent grab-and-go restaurant) and two are full-service restaurants. Sources were Google (2,093 reviews), Uber Eats (156), Yelp (114) and TripAdvisor (2). The window is April 1 to October 25, 2026. Records marked as demo, test or duplicate were excluded, and 24 repeat copies of the same review (same store, same text, same rating) were removed, keeping the first. The data was queried on October 26, 2026.
Timing
The six accounts started using Replio between May 15 and June 24, 2026. April 1 to May 14 predates Replio at every store; the rest of the window covers each store's first weeks or months of use.
Complaint topics
Each review was tagged by Replio's automatic categorizer, which reads the review and assigns one or more topics, each marked positive, negative or neutral. A complaint is a topic marked negative. About 9 in 10 reviews rated three stars or lower carried at least one topic. Similar labels were merged before counting: Speed of Service, Wait Time and Drive-Thru Experience became "Speed and wait"; Staff Friendliness, Team Friendliness and Hospitality became "Friendliness"; mobile, app and delivery labels became "Digital and delivery". Some drive-thru complaints are about attitude rather than speed, so "Speed and wait" is slightly overstated.
Label check
Two random samples of 40 complaint labels each (80 in total) were read against the review text they came from. 68 clearly matched, 7 were debatable and 5 were wrong. As a second check, every headline finding was recomputed using only labels the categorizer marked high confidence; none changed by more than a few reviews.
Measures
- Complaint review: a review with at least one negative topic.
- Complaint reviews by star rating: the 333 complaint reviews grouped by the rating the guest gave. The share rated four or five stars is 71 of 333.
- Praise or complaint by topic: each review counted once per topic and direction.
- Store-month: one store in one calendar month, April to September 2026. Every store had reviews in all six months. October was incomplete and left out.
- Intervals: 95 percent Wilson intervals on review-level proportions. Reviews from the same store are not fully independent, so treat the intervals as a lower bound on uncertainty.
Consent and privacy
Each owner agreed to anonymous publication of aggregate results. The report shows totals by restaurant type and anonymized store rates, never a business name, reviewer name or review text.
Limits
- Eight restaurants is a case study. Six owners, five states, two kinds of restaurant. It does not describe restaurants in general, and five of the eight stores share one brand.
- Not independent. All six owners are Replio customers. Replio wrote this report.
- Collected reviews, not every review. Replio may not have collected every review posted in the window, and one store contributes nearly half the reviews.
- Automatic labels. About 85 percent of checked labels were clearly right, not all of them.
- Busy stores repeat more. A store with more reviews has more chances to repeat a complaint in a month, and a repeated topic does not prove the same root cause.
- No cause and effect. This report describes what guests wrote. It does not show what any action, or Replio, changed, and it does not show how these stores handled the complaints.
- Reply speed is left out. Our reply timestamps are not reliable enough to publish.
Data and citation
The aggregate numbers behind every chart are in restaurant-review-complaints-2026.csv, and the queries that produced them are in restaurant-review-complaints-2026.sql. A one-page summary is in the PDF. No sign-up needed, and the aggregate data may be reused with credit under CC BY 4.0. The underlying reviews belong to the participating restaurants and are not published. We plan to rerun this study with the same method in 2027 and publish what changed, including if nothing did.
Cite as: Kubala, C. (2026). Good Ratings Hide Restaurant Complaints: A 2026 Case Study of 2,365 Reviews at Eight Restaurants. Replio. https://www.repliohq.com/reports/restaurant-review-complaints-2026
Frequently asked questions
Do four and five star reviews contain complaints?
Yes. In this case study, 71 of the 333 reviews that named a specific complaint, about 1 in 5, were rated four or five stars. It happened at all eight stores. Seen from the other side, 71 of 2,064 four and five star reviews (about 1 in 29) named a problem.
What does a team miss if it reads only one and two star reviews?
In this study, 137 of 333 complaint reviews (about 4 in 10) were rated three, four or five stars, so a process that starts from the lowest ratings would never see them.
What do restaurant guests complain about most in reviews?
In this case study of 2,365 reviews at eight restaurants, the most common complaint topics were order accuracy, speed and wait, friendliness and food quality. Counter-service guests led with order accuracy and speed; full-service guests led with food quality, friendliness and speed.
How many restaurant reviews contain a complaint?
333 of 2,365 reviews (14 percent, about 1 in 7) named at least one specific complaint. The rate ranged from 6 percent to 34 percent between stores.
Why is order accuracy different from other complaints?
It is almost never praised. Across the study, 119 reviews complained about order accuracy and 16 praised it, and complaints outnumbered praise at all eight stores. Friendliness, food quality and speed all drew more praise than complaints.
How does Replio help with complaints that keep coming back?
Replio tags every review with text, at every star rating, by topic and tracks complaints per store and topic. An owner or leader assigns the issue to one person with a due date. The assignee marks it done, and a manager verifies it; the assignee cannot verify their own work. Replio then compares later reviews on that topic at that store and reports Improving, Worsening, No measurable change, or not enough reviews yet. A manager's confirmation records that work was reported complete; it does not prove guests noticed. This case study does not measure Replio's effect.
Is this study representative of all restaurants?
No. It is a case study of eight restaurants from six owners who are Replio customers and agreed to anonymous publication. It describes those stores, not the restaurant industry.